
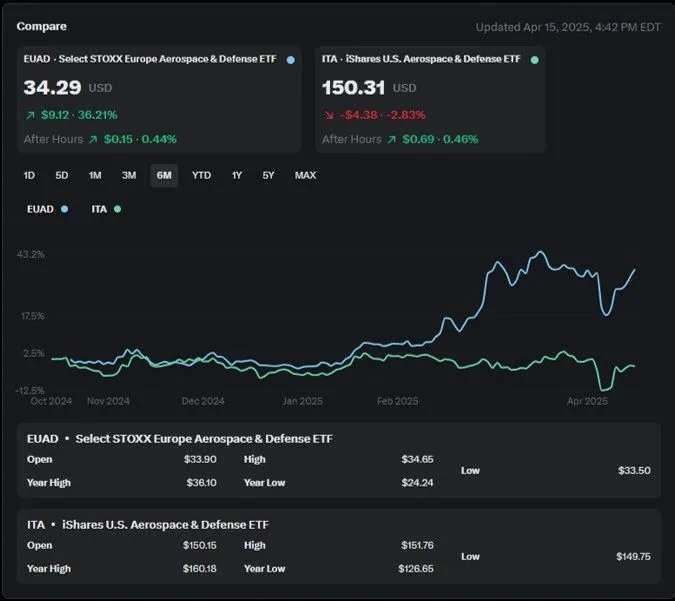
The defense sector, long a cornerstone of global markets, is witnessing a striking divergence in 2025. European defense stocks are soaring, fueled by aggressive rearmament and a push for strategic autonomy, while U.S. defense stocks face headwinds from policy uncertainty and shifting priorities. We looked into the forces driving this split, specifically by comparing two key ETFs: the Select STOXX Europe Aerospace & Defense ETF ($EUAD) and the iShares U.S. Aerospace & Defense ETF ($ITA). Let's explore what's happening, why it matters, and what investors should consider.
The Big Picture: Geopolitical Shifts Reshaping Defense
Europe is in the midst of a defense renaissance. Spurred by concerns over the U.S. commitment to NATO—particularly after pauses in military aid to Ukraine—and the ongoing conflict in the region, European nations are boosting budgets and prioritizing local manufacturers. The EU's ReArm Europe plan aims to mobilize up to €800 billion ($862 billion) for defense, with countries like Germany, France, and the UK committing to raise spending to 3% or more of GDP by 2030. This has ignited a rally in European defense firms, which are seen as direct beneficiaries of increased orders and long-term contracts.
Meanwhile, U.S. defense stocks are grappling with a different reality. The Trump administration's focus on domestic priorities and skepticism toward NATO obligations has raised fears of reduced military budgets or reallocated spending. Tariffs introduced in 2025, including a 25% levy on aluminum, have also hit aerospace firms hard, as 80% of aircraft rely on this commodity. The result? A sluggish performance for U.S. defense companies, with investors questioning their growth prospects in a potentially inward-looking policy environment.
Comparing $EUAD and $ITA: A Tale of Two Markets
To understand this divergence, let's compare two ETFs that capture the performance of their respective defense sectors: $EUAD, which tracks European aerospace and defense, and $ITA, which is focused on U.S. equities in the same space.
Select STOXX Europe Aerospace & Defense ETF ($EUAD)
Focus: It tracks the STOXX Europe Aerospace & Defense Index, which covers 13 European companies in civil and military aerospace equipment, defense technology, and protective services. Key holdings include Airbus (EADSY) and Safran (SAFRY), which together account for 44% of the fund. Over 50% of its weight is in French firms, followed by 23% in the UK and 16% in Germany.
Performance: As of April 15, 2025, $EUAD's current price is $34.29, up 39% year-to-date (YTD). Over the past month, it gained 2.21% (from $33.53 on March 17 to $34.29); over the past year, it's risen 38.7% (from $24.68 in October 2024). Its 1-year high is $36.10, reflecting strong momentum.
Assets and Structure: Launched in October 2024, $EUAD is a focused fund with just 13 holdings, making it concentrated but aligned with Europe's defense surge. It has a 0.48% expense ratio, which is reasonable for a specialized ETF.
Drivers: Europe's defense spending boom, including Germany's €86 billion military budget in 2024 (up 25%) and the UK's pledge to hit 2.5% of GDP by 2027, directly benefits $EUAD's holdings. The EU's "Buy European" push further insulates these firms from U.S. competition.
iShares U.S. Aerospace & Defense ETF ($ITA)
Focus: Tracks the Dow Jones U.S. Select Aerospace & Defense Index, with 39 holdings including GE Aerospace (19.98%), RTX Corp, and Boeing. The top 10 holdings comprise 77.27% of the fund, making it top-heavy but diversified across U.S. aerospace and defense.
Performance: As of April 15, 2025, $ ITA's current price is $150.31, down 5.3% YTD. Over the past month, it lost 1.83% (from $153.10 on March 17 to $150.31), though it's up 15.8% over the past year (from $129.85 in April 2024). Its 1-year high was $160.18, indicating a recent pullback.
Assets and Structure: Launched in May 2006, $ITA is one of the largest defense ETFs, with $6.21 billion in assets. Its 0.40% expense ratio is slightly lower than that of $EUAD, and it offers a 0.5% dividend yield.
Drivers: $ITA has been hit by tariff-related cost increases and uncertainty over U.S. defense budgets. A proposed $1 trillion defense budget for 2026 offers hope, but losses in early April 2025 (down 10.9% YTD as of April 8) reflect investor caution.
Head-to-Head:
Performance Gap: $EUAD's 39% YTD gain dwarfs $ ITA's 5.3% YTD loss, highlighting Europe's outperformance. Over one month, $ EUAD's 2.21% gain contrasts with $ ITA's 1.83% decline.
Volatility: $ ITA's beta of 0.99 and three-year standard deviation of 18.07% suggest moderate risk, but its concentrated holdings amplify exposure to tariff and policy shocks. $EUAD, with fewer holdings, is riskier in theory but has been steadier due to strong European demand.
Market Dynamics: $EUAD benefits from a straightforward growth narrative—Europe's rearmament and local procurement. $ITA, despite its size, faces headwinds from U.S. policy uncertainty and trade disruptions.
Why the Divergence?
Europe's Strategic Pivot
Europe's defense sector is thriving on necessity. The Ukraine conflict and fears of a U.S. NATO pullback have pushed countries to act. Germany's Rheinmetall, France's Thales, and Italy's Leonardo (all represented in $EUAD) are seeing record orders, with Rheinmetall alone up 194% over 12 months ending March 2025. The EU's focus on local firms ensures these companies capture most of the spending surge, giving $EUAD a direct tailwind.
U.S. Policy Uncertainty
U.S. defense firms, heavily weighted in $ITA, are caught in a policy quagmire. The pause in Ukraine aid and tariff-driven cost hikes have spooked investors. Lockheed Martin, Northrop Grumman, and General Dynamics—key $ITA holdings—saw double-digit declines in February 2025. While a potential $1 trillion budget could lift sentiment, clarity is lacking, keeping $ITA under pressure.
Global Trade and Tariffs
U.S. tariffs, particularly on aluminum, have raised costs for aerospace firms in $ITA, which rely heavily on global supply chains. While not immune, European firms in $EUAD are cushioned by intra-EU supply chains and government-backed contracts, reducing their exposure to trade wars.
What's Next for Investors?
Bull Case for $EUAD: Europe's defense spending is projected to hit 3.5% of its GDP by 2032, adding $300 billion annually. $EUAD's concentrated exposure to top European players positions it to ride this wave. However, its 13-stock portfolio means higher stock-specific risk, and any de-escalation in Ukraine could temper gains.
Bull Case for $ITA: If the U.S. clarifies its defense budget or reaffirms NATO commitments, $ITA could rebound. Its diversified holdings and $6.21 billion in assets offer stability, and a 0.5% dividend yield adds income appeal. But tariffs and policy uncertainty remain hurdles.
Risks: Both ETFs are sensitive to geopolitics. A Russia-Ukraine truce could cool European defense stocks, hitting $EUAD. For $ITA, prolonged trade disputes or budget cuts could deepen losses. Investors should also watch global supply chain disruptions, which affect both regions.
Final Thoughts
The defense sector's transatlantic divide reflects deeper geopolitical currents. Europe's $EUAD is riding a wave of rearmament and local prioritization, delivering a stellar 39% YTD gain. In contrast, $ ITA's 5.3% YTD loss underscores U.S. challenges—tariffs, budget uncertainty, and a shifting NATO role. For investors, $EUAD offers high-growth potential with concentrated risk, while $ITA provides diversification but faces near-term headwinds. Understanding these dynamics is key to navigating this critical sector as global tensions evolve.
Opportunities and Strategies for Investors
For those looking to capitalize on this divergence, here are a few strategies to consider:
- Riding the European Wave with $EUAD: If you believe Europe's defense spending will continue its upward trajectory, $EUAD's focused exposure to companies like Airbus and Safran makes it a compelling choice. Its 0.48% expense ratio is reasonable for a specialized ETF, but its 13-stock concentration means you're betting heavily on a few players. Pairing $EUAD with broader European market ETFs could balance risk while maintaining exposure to the defense boom.
- Finding Value in $ITA: Despite its struggles, $ITA isn't without merit. Its $6.21 billion in assets and 39 holdings offer a buffer against single-stock volatility, and names like GE Aerospace and RTX remain global leaders. If U.S. policy stabilizes, say with a reaffirmed NATO commitment or a clearer 2026 budget, $ITA could rebound. Its 0.5% dividend yield also appeals to income-focused investors. Consider a wait-and-see approach, buying on dips if sentiment improves.
- Hedging Geopolitical Risks: The defense sector thrives on uncertainty but is also vulnerable to rapid shifts. A Russia-Ukraine ceasefire, for instance, could cool European defense stocks, denting $EUAD's momentum. Similarly, U.S. trade policies could further pressure $ITA's aerospace-heavy portfolio. Diversifying across both ETFs, or blending them with global defense funds like the Global X Defense Tech ETF, could mitigate regional risks while capturing sector growth.
The Bigger Picture
This divergence isn't just about stock prices—it's a window into a shifting global order. Europe's push for defense autonomy signals a new era of self-reliance, potentially reshaping alliances and supply chains. For $EUAD investors, this translates to a straightforward growth narrative as European governments funnel billions into local firms. But it also raises questions about sustainability: Can Europe maintain this pace without U.S. support, and what happens if geopolitical tensions ease?
The challenges are immediate but not insurmountable for $ITA and the U.S. defense sector. The U.S. remains the world's largest defense market, with unmatched technological expertise. Yet, tariffs and policy ambiguity are testing investors' patience. If the U.S. can clarify its defense priorities, perhaps through strategic partnerships with European firms, $ITA could regain its footing.
Conclusion
The $EUAD and $ITA tale is a microcosm of broader transatlantic trends. Europe's defense stocks, captured by $ EUAD's 39% YTD surge, are thriving on a once-in-a-generation rearmament drive. Meanwhile, $ ITA's 5.3% YTD decline reflects a U.S. sector caught in policy crosswinds. For investors, the choice depends on your risk appetite and outlook: $EUAD for high-growth exposure to Europe's defense renaissance or $ITA for a diversified bet on a potential U.S. recovery.
As we move through 2025, keep an eye on key catalysts: EU budget announcements, U.S. trade policy updates, and developments in Ukraine. These will shape whether this divergence widens or narrows. For now, the defense sector remains a fascinating battleground of opportunity and uncertainty. How do you think this transatlantic divide will unfold?
Disclaimer: The information provided in this blog post is for informational and educational purposes only and does not constitute financial, investment, or professional advice. The content reflects general market commentary and analysis as of April 15, 2025, and is subject to change without notice. Neither Vivek Sharma nor anyone affiliated with Gwynedd Wealth Partners, LLC guarantees the accuracy, completeness, or suitability of the information provided.
Investing in securities, including ETFs such as $EUAD and $ITA, involves risks, including the potential loss of principal. Past performance is not indicative of future results. Investors should conduct their own research or consult with a qualified financial advisor before making any investment decisions. The mention of specific securities, sectors, or strategies does not constitute a recommendation or endorsement to buy, sell, or hold any investment.
Readers are responsible for their own investment decisions and should consider their individual financial circumstances, risk tolerance, and objectives. For personalized advice, please contact a licensed financial professional.
This blog post may contain forward-looking statements based on current expectations, which are subject to risks and uncertainties that could cause actual results to differ materially. External sources, including web data and posts on X and LinkedIn, have been referenced where applicable, but their accuracy is not guaranteed. Always verify information independently before acting on it.
This article is general information, not personalized advice. Investment advisory services are offered through Gwynedd Wealth Partners, LLC.